名称
ST_ClusterKMeans — 使用 K 均值算法返回每个输入几何图形的簇 id 的窗口函数。
大纲
integer ST_ClusterKMeans( geometry winset geom , integer k , float8 max_radius );
描述
返回每个输入几何图形的 K-means 簇号。 用于聚类的距离是 2D 几何形状的质心之间的距离,以及 3D 几何形状的边界框中心之间的距离。 对于 POINT 输入,M 坐标将被视为输入的权重,并且必须大于 0。
max_radius 如果设置,将导致 ST_ClusterKMeans 生成比 k 更多的簇,确保输出中没有簇的半径大于 max_radius。 这在可达性分析中很有用。
增强:3.2.0 支持 max_radius
增强:3.1.0 支持 3D 几何和权重
可用性:2.3.0
示例
Define the parcel geometries once in a CTE and reuse them across the executable examples.
Parcels color-coded by cluster number (cid).
WITH parcels(parcel_id, geom) AS (
  VALUES
    ('A1', ST_MakeEnvelope(0, 0, 10, 10)),
    ('A2', ST_MakeEnvelope(10, 0, 20, 10)),
    ('B1', ST_MakeEnvelope(100, 0, 110, 10)),
    ('B2', ST_MakeEnvelope(110, 0, 120, 10)),
    ('C1', ST_MakeEnvelope(200, 0, 210, 10)),
    ('C2', ST_MakeEnvelope(210, 0, 220, 10))
), clustered AS (
  SELECT parcel_id,
         geom,
         ST_ClusterKMeans(geom, 3) OVER (ORDER BY parcel_id) AS cid
  FROM parcels
)
SELECT cid,
       string_agg(parcel_id, ',' ORDER BY parcel_id) AS parcels,
       ST_Union(geom) AS cluster_geom
FROM clustered
GROUP BY cid
ORDER BY cid;
0 | C1,C2 | POLYGON((200 10,210 10,220 10,220 0,210 0,200 0,200 10))
1 | A1,A2 | POLYGON((0 10,10 10,20 10,20 0,10 0,0 0,0 10))
2 | B1,B2 | POLYGON((100 10,110 10,120 10,120 0,110 0,100 0,100 10))
按类型划分地块集群:
WITH parcel_geoms AS (
  SELECT geom
  FROM ST_Subdivide(
    ST_Buffer('SRID=3857;LINESTRING(40 100,98 100,100 150,60 90)'::geometry,
              40, 'endcap=square'),
    12) AS geom
), parcels AS (
  SELECT lpad(row_number() OVER (ORDER BY ST_YMin(geom), ST_XMin(geom))::text, 3, '0') AS parcel_id,
         geom,
         ('{residential,commercial}'::text[])[1 + mod(row_number() OVER (ORDER BY ST_YMin(geom), ST_XMin(geom)), 2)] AS type
  FROM parcel_geoms
)
SELECT ST_ClusterKMeans(geom, 3) over (PARTITION BY type) AS cid,
       parcel_id,
       type,
       ST_SnapToGrid(geom, 1) AS parcel_geom
FROM parcels
ORDER BY type, parcel_id;
cid | parcel_id |    type     | parcel_geom
-----+-----------+-------------+--------------------------------------------------------------
   0 | 001       | commercial  | POLYGON((33 60,0 60,0 98,71 98,71 35,33 60))
   2 | 003       | commercial  | POLYGON((106 98,138 98,137 91,134 84,131 77,126 71,120 66,113 63,106 61,106 98))
   2 | 005       | commercial  | POLYGON((140 148,138 98,72 98,72 148,140 148))
   1 | 007       | commercial  | POLYGON((109 189,116 187,123 183,129 178,134 171,137 164,139 156,140 148,109 148,109 189))
   0 | 002       | residential | POLYGON((71 98,106 98,106 61,98 60,88 60,71 35,71 98))
   2 | 004       | residential | POLYGON((0 98,0 140,45 140,67 172,72 178,72 98,0 98))
   1 | 006       | residential | POLYGON((72 178,78 183,85 187,93 189,101 190,109 189,109 148,72 148,72 178))
Example: Clustering a preaggregated planetary-scale data population dataset using 3D clustering and weighting. Identify at least 20 regions based on Kontur Population Data that do not span more than 3000 km from their center:
CREATE TABLE kontur_population_3000km_clusters AS
SELECT
    geom,
    ST_ClusterKMeans(
        ST_Force4D(
            ST_Transform(ST_Force3D(geom), 4978),
            mvalue => population
        ),
        20,
        max_radius => 3000000
    ) OVER () AS cid
FROM kontur_population;
The clustering produces 46 regions. Clusters are centered at well-populated regions such as New York and Moscow. Greenland forms one cluster, several island clusters span the antimeridian, and cluster edges follow the Earth's curvature.
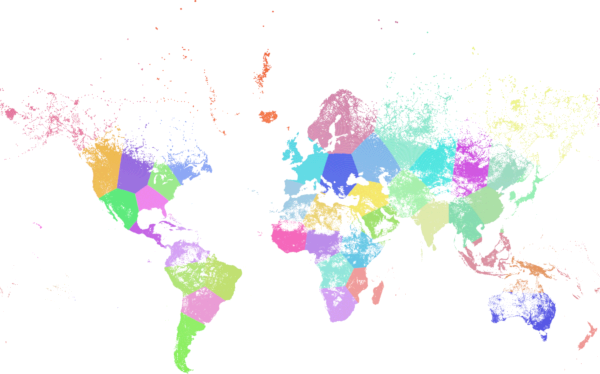
Kontur population clustered with 3000 km maximum radius.
Cluster weighted city populations on the Earth in geocentric coordinates. The maximum radius is specified in meters, while the returned geometries stay in WGS 84 for display.
WITH population(place, population, geom) AS (
  VALUES
    ('Boston', 5.0, ST_SetSRID(ST_Point(-71.06, 42.36), 4326)),
    ('New York', 20.0, ST_SetSRID(ST_Point(-74.01, 40.71), 4326)),
    ('London', 15.0, ST_SetSRID(ST_Point(-0.13, 51.51), 4326)),
    ('Paris', 11.0, ST_SetSRID(ST_Point(2.35, 48.86), 4326)),
    ('Osaka', 19.0, ST_SetSRID(ST_Point(135.50, 34.69), 4326)),
    ('Tokyo', 37.0, ST_SetSRID(ST_Point(139.69, 35.68), 4326)),
    ('Melbourne', 5.0, ST_SetSRID(ST_Point(144.96, -37.81), 4326)),
    ('Sydney', 5.0, ST_SetSRID(ST_Point(151.21, -33.87), 4326))
), clustered AS (
  SELECT place,
         geom,
         ST_ClusterKMeans(
           ST_Force4D(
             ST_Transform(ST_Force3D(geom), 4978),
             mvalue => population
           ),
           4,
           max_radius => 3000000
         ) OVER (ORDER BY place) AS cid
  FROM population
)
SELECT cid,
       string_agg(place, ', ' ORDER BY place) AS places,
       ST_Collect(geom ORDER BY place) AS cluster_geom
FROM clustered
GROUP BY cid
ORDER BY cid;
0 | Melbourne, Sydney | MULTIPOINT((144.96 -37.81),(151.21 -33.87))
1 | Boston, New York | MULTIPOINT((-71.06 42.36),(-74.01 40.71))
2 | Osaka, Tokyo | MULTIPOINT((135.5 34.69),(139.69 35.68))
3 | London, Paris | MULTIPOINT((-0.13 51.51),(2.35 48.86))