名前
ST_ClusterKMeans — 入力ジオメトリーごとに k 平均法アルゴリズムを使ってクラスタ番号を返すウィンドウ関数です。
概要
integer ST_ClusterKMeans( geometry winset geom , integer k , float8 max_radius );
説明
入力ジオメトリーごとの K 平均法 のクラスタ番号を返します。クラスタリングに使われる距離は、2次元ジオメトリーでは重心間の距離、3次元ジオメトリーではバウンディングボックスの中心点間の距離です。POINT 入力では、M 値は入力の重みとして扱われ、0より大きくなければなりません。
max_radius が設定されている場合には、ST_ClusterKMeans は、出力クラスタが max_radius より半径が大きいクラスタを作らなくなるので、k より多いクラスタを生成します。到達可能性分析に使います。
Enhanced: 3.2.0 max_radius パラメーターに対応しました
Enhanced: 3.1.0 3次元ジオメトリーと重みに対応するようになりました
Availability: 2.3.0
例
一度 CTE 内で小包ジオメトリーを定義して、実行可能な例で再利用します。
クラスター番号 (cid) ごとに色符号を指定された小包。
WITH parcels(parcel_id, geom) AS (
  VALUES
    ('A1', ST_MakeEnvelope(0, 0, 10, 10)),
    ('A2', ST_MakeEnvelope(10, 0, 20, 10)),
    ('B1', ST_MakeEnvelope(100, 0, 110, 10)),
    ('B2', ST_MakeEnvelope(110, 0, 120, 10)),
    ('C1', ST_MakeEnvelope(200, 0, 210, 10)),
    ('C2', ST_MakeEnvelope(210, 0, 220, 10))
), clustered AS (
  SELECT parcel_id,
         geom,
         ST_ClusterKMeans(geom, 3) OVER (ORDER BY parcel_id) AS cid
  FROM parcels
)
SELECT cid,
       string_agg(parcel_id, ',' ORDER BY parcel_id) AS parcels,
       ST_Union(geom) AS cluster_geom
FROM clustered
GROUP BY cid
ORDER BY cid;
0 | C1,C2 | POLYGON((200 10,210 10,220 10,220 0,210 0,200 0,200 10))
1 | A1,A2 | POLYGON((0 10,10 10,20 10,20 0,10 0,0 0,0 10))
2 | B1,B2 | POLYGON((100 10,110 10,120 10,120 0,110 0,100 0,100 10))
タイプ別による区画の分割:
WITH parcel_geoms AS (
  SELECT geom
  FROM ST_Subdivide(
    ST_Buffer('SRID=3857;LINESTRING(40 100,98 100,100 150,60 90)'::geometry,
              40, 'endcap=square'),
    12) AS geom
), parcels AS (
  SELECT lpad(row_number() OVER (ORDER BY ST_YMin(geom), ST_XMin(geom))::text, 3, '0') AS parcel_id,
         geom,
         ('{residential,commercial}'::text[])[1 + mod(row_number() OVER (ORDER BY ST_YMin(geom), ST_XMin(geom)), 2)] AS type
  FROM parcel_geoms
)
SELECT ST_ClusterKMeans(geom, 3) over (PARTITION BY type) AS cid,
       parcel_id,
       type,
       ST_SnapToGrid(geom, 1) AS parcel_geom
FROM parcels
ORDER BY type, parcel_id;
cid | parcel_id |    type     | parcel_geom
-----+-----------+-------------+--------------------------------------------------------------
   0 | 001       | commercial  | POLYGON((33 60,0 60,0 98,71 98,71 35,33 60))
   2 | 003       | commercial  | POLYGON((106 98,138 98,137 91,134 84,131 77,126 71,120 66,113 63,106 61,106 98))
   2 | 005       | commercial  | POLYGON((140 148,138 98,72 98,72 148,140 148))
   1 | 007       | commercial  | POLYGON((109 189,116 187,123 183,129 178,134 171,137 164,139 156,140 148,109 148,109 189))
   0 | 002       | residential | POLYGON((71 98,106 98,106 61,98 60,88 60,71 35,71 98))
   2 | 004       | residential | POLYGON((0 98,0 140,45 140,67 172,72 178,72 98,0 98))
   1 | 006       | residential | POLYGON((72 178,78 183,85 187,93 189,101 190,109 189,109 148,72 148,72 178))
例: 3次元クラスタリングと重みづけを使って、事前集約している惑星全体レベルの人口データセットにクラスタリングを行います。Kontur Population Data に基づいて、中心から 3000 km を超えて及ばないように、少なくとも 20地域に分割します。
CREATE TABLE kontur_population_3000km_clusters AS
SELECT
    geom,
    ST_ClusterKMeans(
        ST_Force4D(
            ST_Transform(ST_Force3D(geom), 4978),
            mvalue => population
        ),
        20,
        max_radius => 3000000
    ) OVER () AS cid
FROM kontur_population;
クラスタリングで 46領域が生成されます。クラスターは、ニューヨークやモスクワなどの人口が集中している点を中心とします。グリーンランドは一つのクラスターで、いくつかの島のクラスターは緯度 180度線をまたぎ、クラスターのエッジは地球の曲率に従っています。
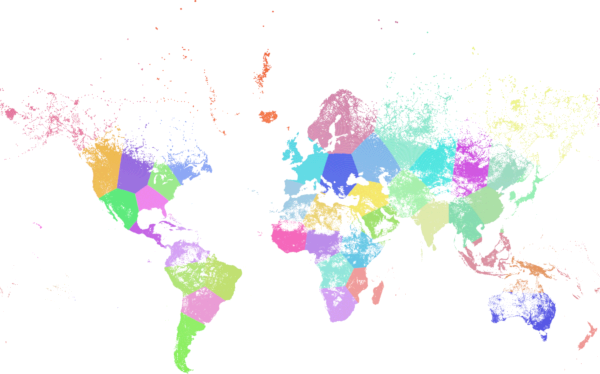
最大半径 3000km でクラスタリング下 Kontur 人口。
地心座標系で地球上の都市人口を重みとしてクラスタリングを行います。最大半径はメートル単位で指定します。ただし表示用に WGS 84 のままのジオメトリーが返されます。
WITH population(place, population, geom) AS (
  VALUES
    ('Boston', 5.0, ST_SetSRID(ST_Point(-71.06, 42.36), 4326)),
    ('New York', 20.0, ST_SetSRID(ST_Point(-74.01, 40.71), 4326)),
    ('London', 15.0, ST_SetSRID(ST_Point(-0.13, 51.51), 4326)),
    ('Paris', 11.0, ST_SetSRID(ST_Point(2.35, 48.86), 4326)),
    ('Osaka', 19.0, ST_SetSRID(ST_Point(135.50, 34.69), 4326)),
    ('Tokyo', 37.0, ST_SetSRID(ST_Point(139.69, 35.68), 4326)),
    ('Melbourne', 5.0, ST_SetSRID(ST_Point(144.96, -37.81), 4326)),
    ('Sydney', 5.0, ST_SetSRID(ST_Point(151.21, -33.87), 4326))
), clustered AS (
  SELECT place,
         geom,
         ST_ClusterKMeans(
           ST_Force4D(
             ST_Transform(ST_Force3D(geom), 4978),
             mvalue => population
           ),
           4,
           max_radius => 3000000
         ) OVER (ORDER BY place) AS cid
  FROM population
)
SELECT cid,
       string_agg(place, ', ' ORDER BY place) AS places,
       ST_Collect(geom ORDER BY place) AS cluster_geom
FROM clustered
GROUP BY cid
ORDER BY cid;
0 | Melbourne, Sydney | MULTIPOINT((144.96 -37.81),(151.21 -33.87))
1 | Boston, New York | MULTIPOINT((-71.06 42.36),(-74.01 40.71))
2 | Osaka, Tokyo | MULTIPOINT((135.5 34.69),(139.69 35.68))
3 | London, Paris | MULTIPOINT((-0.13 51.51),(2.35 48.86))